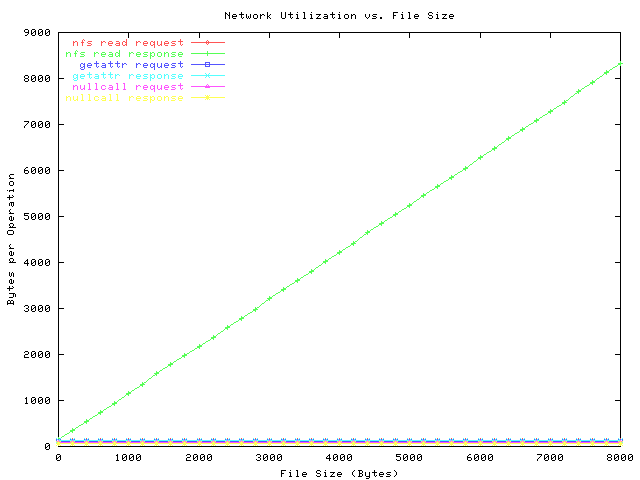
The response to the read request scales as the size of the file, and is given exactly as
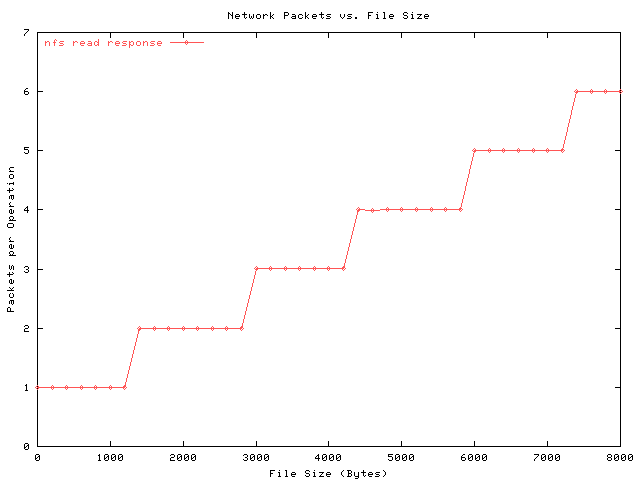
Note the knee at 1500 bytes. At this point, the nfs read response requires more than one UDP packet to respond. (The 1500 comes from the ethernet Maximum Transmission Unit (MTU)). Note the absence of bumps at 3000, 4500, etc. The number of packets per response is shown below.

The graph below is similar, except that it shows the number of bytes per operation.
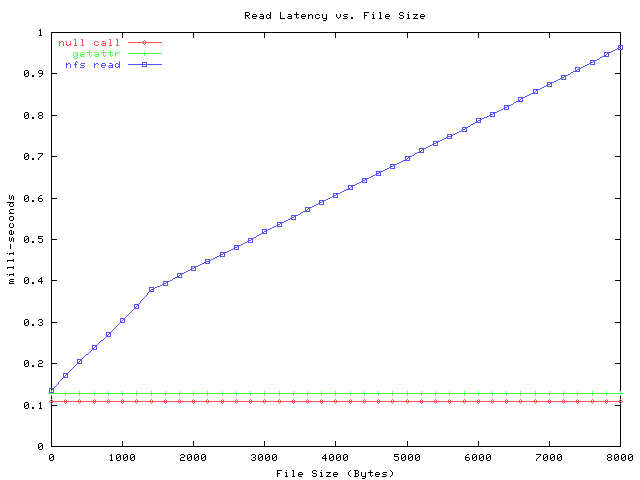
Its derived by multiplying the latency times the bitrate above.
The response to the read request scales as the size of the file, and is given
exactly as
response bytes = (requested file size) + 106 + 36 *(number of response packets)
The other traffic is constant, and independent of the file size. Each request/response requires exactly one packet, and the number of bytes in each packet is:

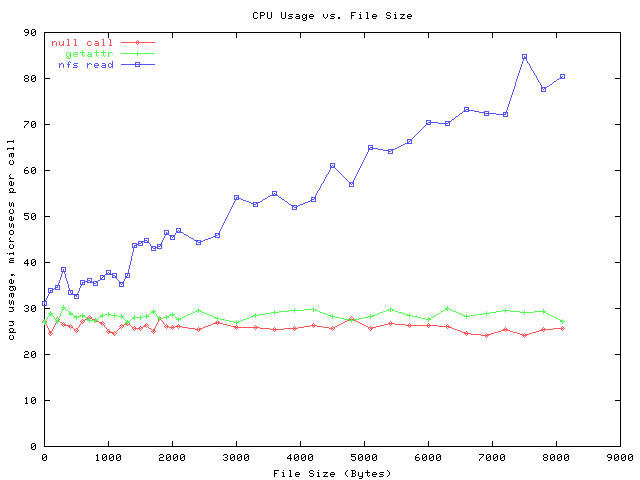
The graph below shows the cpu-usage, in microseconds per call. We get this
graph by multiplying the percent-busy data by the elapsed-time data. It shows
the actual cycles burned to satisfy one request, inclusive of context switches,
interrupts, nbetwork processing, etc. Note the null call and getattr call sit
nearly on top of one another: this is consistent with earlier data, where the
getattr call takes only 2.75 microsecond more than nullcall.
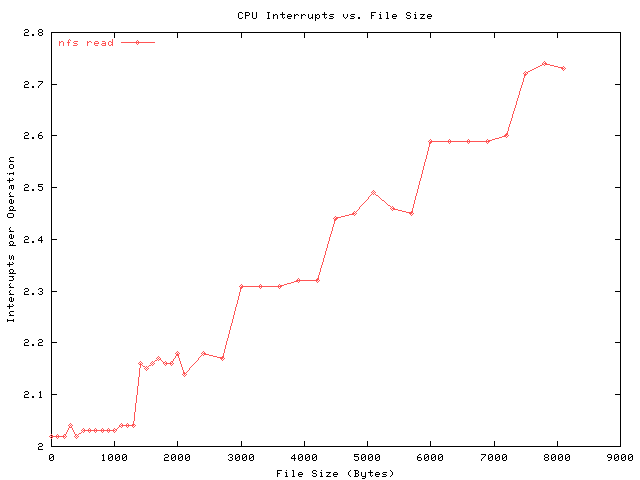
The next graph shows the number of interrupts handled per read operation.
It seems to stairstep an extra sixth of an interrupt per UDP packet. Note
that getattr and nullcall take two interrupts per operation.
In all cases, (nullcall, getattr, and read) context switches remain constant
at three per operation.