I've drawn pictures of the iterated circle map before. They're visible elsewhere on this website, and also on Wikipedia, in the article for Arnold Tongues. This page is a reprise of that theme. Besides the circle map, two more maps are considered: a triangle wave, thus replacing the sine wave by something piece-wise linear, and a sawtooth wave, which makes the map resemble a cock-eyed Bernoulli process. This is intersting, as the Bernoulli process is considered to be well-understood, so this seems like a natural simplifying step.
An attempt to understand the pre-requisite math for the simpler systems can be found here and also on ArXiv:1812.10593. In short, the piece-wise linear parts form the β-transform; these are ergodic, but combine in a complex, overlayed fashion. The sinusoid of the circle map further twists these about.
The circle map is the iterated equation
θn+1 = θn + ω - Ksin(2π θn)
It is useful to think of θ as an angle, running from zero to one. The ω is the constant angular velocity of the driven motor. A time-step of Δt=1 is omitted from the above. The K is related to the spring constant between the two rotors.
The picture below illustrates the winding number in the limit of a large number of iterations. That is, it shows, in color, the value of
Ω = limn→∞ θn / n
with black representing Ω=0, red representing Ω=1, and green representing Ω=1/2, and the other colors in between. The value of ω ranges from zero to one alone the horizontal axis, and the value of K ranges from zero to one along the vertical axis. The Arnold tongues are clearly visible.
The next picture below shows the Poincaré recurrence time for the map. It color-codes the (average) value for the smallest number of steps N for which the following holds true:
|θ(n+N) - θn| < ε
for some small value of ε. The value used here is about ε=0.003, that is, roughly the size of one pixel. The actual value used for ε doesn't much matter, the picture is always about the same. The color of black corresponds to recurrence times of about N<10, green to N≈125 and red for N>250. The Arnold tongues are the black regions, of course.
Bonus: Click here for a 1920x3840 hi-res version. It's about 5 megabytes.
Below is a photo from Misha Firer, of woods near Moscow, 2021. The visual effect at the horizon caught my eye.
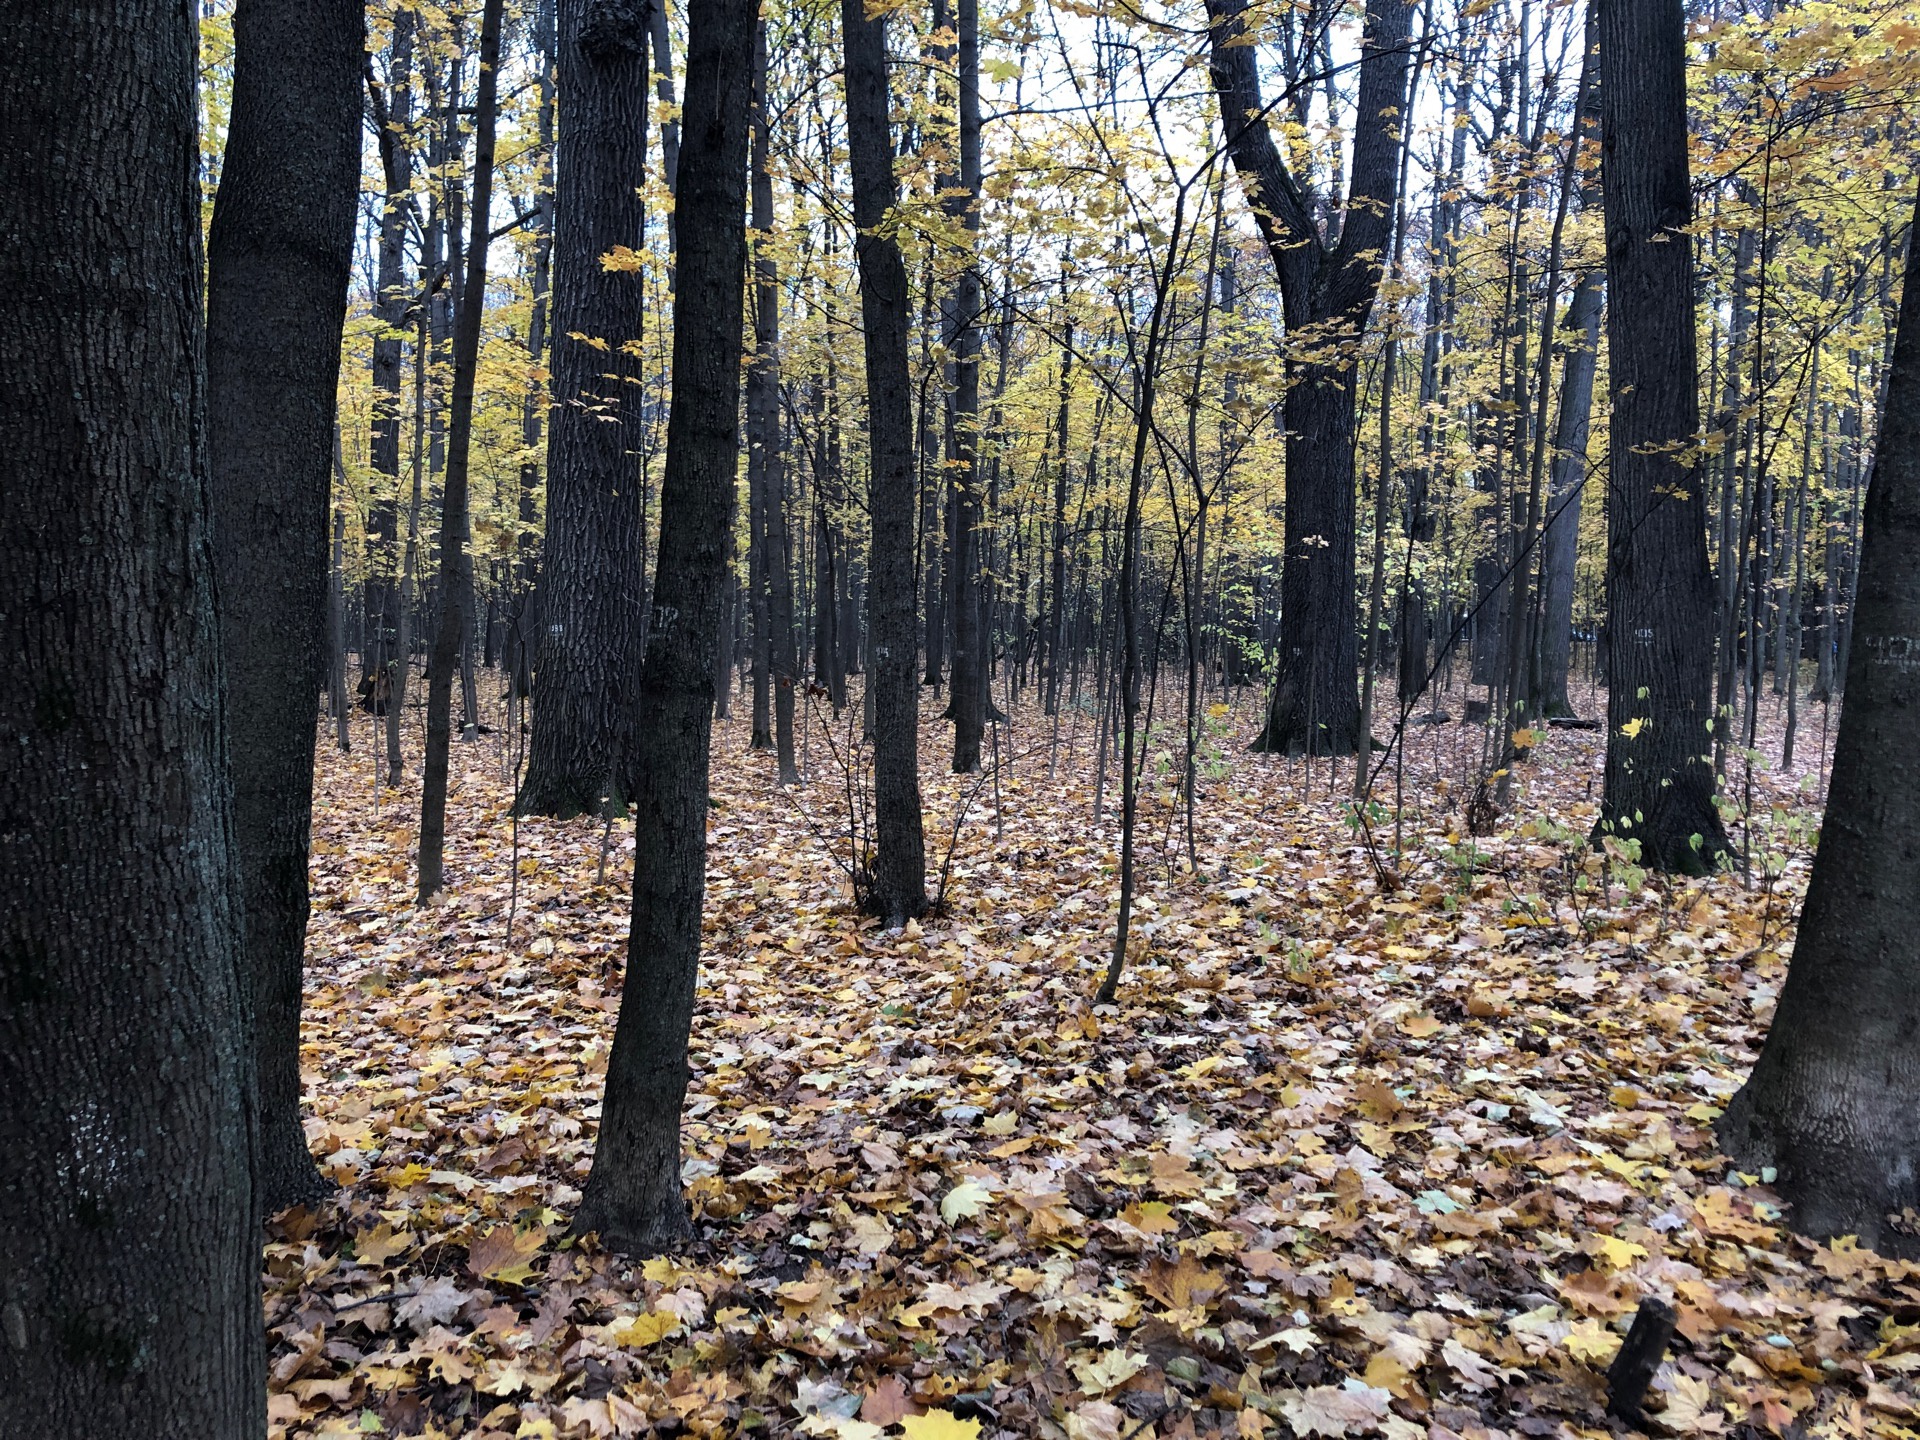
(See the youtube page for description and comments.)
Then, the Poincare recurrence time, as the recurence time to a particular, specific value of θ0 varies from 0 to 1:
(See the youtube page for description and comments.)
I found the above movie surprising. My static pictures are the average of a large number of random samples of θ0, with some first few dozen (?) iterations discarded, so as to let the system relax or thermalize into a state mostly independent of initial conditions. That means that I was measuring the recurrence time for some value of θ, without remarking which one, and without remarking as to it's distribution. It turns out that controlling for this distribution is interesting, too. Who knew?
An eigenfunction of L is any function f=f(x) for which
Lf = λf
The Perron–Frobenius theorem essentially states that, for this situation, the largest eigenvalue is λ=1. These are the functions f that when iterated over and over by the circle map, retain their shape. They do not decay. In general, if one limits oneself to those functions f that are integrable, then one finds that the spectrum is discrete. Presumably, this will hold true for the circle map as well.The Arnold tongues correspond to eigenfunctions δ = δ(θ-xp:q) where the label p:q corresponds to the rational number p/q=Ω that is the winding number Ω for those orbits that the particular tongue is trapping. Well, that's not quite accurate. A more accurate statement is that the eigenfunctions correspond to slices taken in the classic bifurcation diagram: if an orbit is period-N, then the eigenfunction is a sum of N deltas, and so on.
What makes the circle map topologically bizarre is that, based on the visualizations above, it is clear that the Arnold tongues are dense in the space of all L(ω,K). Yet, because these correspond to rationals p/q, there are also an uncountable number of values of (ω,K) for which the eigenfunctions are not the Dirac delta. Can an explicit example of such eigenfunctions be given? Of course, this can be done numerically: just take a slice through the bifurcation diagram in some chaotic region, graph it as an ordinary function, and viola! Are there any explicit, closed-form equations that can be written?
What about the λ<1 eigenfunctions? What does the spectrum look like?
4x when 0 ≤ x ≤ 0.25
tri(x) = 4(0.5-x) when 0.25 ≤ x ≤ 0.75
4(x-1) when 0.75 ≤ x ≤ 1.0
and then extending to the whole real-number line by definingtri(x) = tri(x mod 1)
The analog to the circle map is thenθn+1 = θn + ω - K tri(θn)
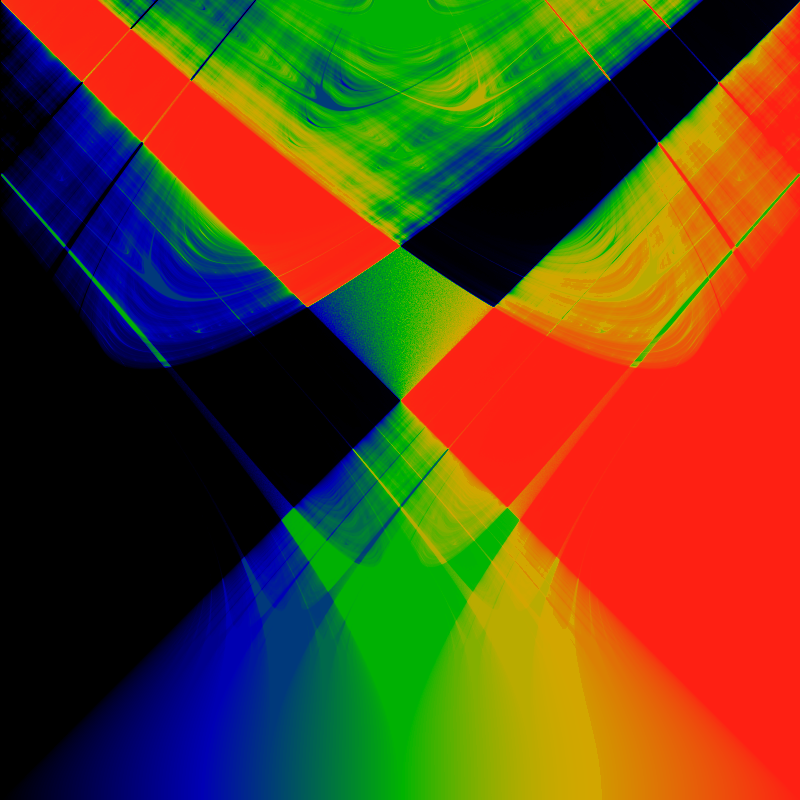
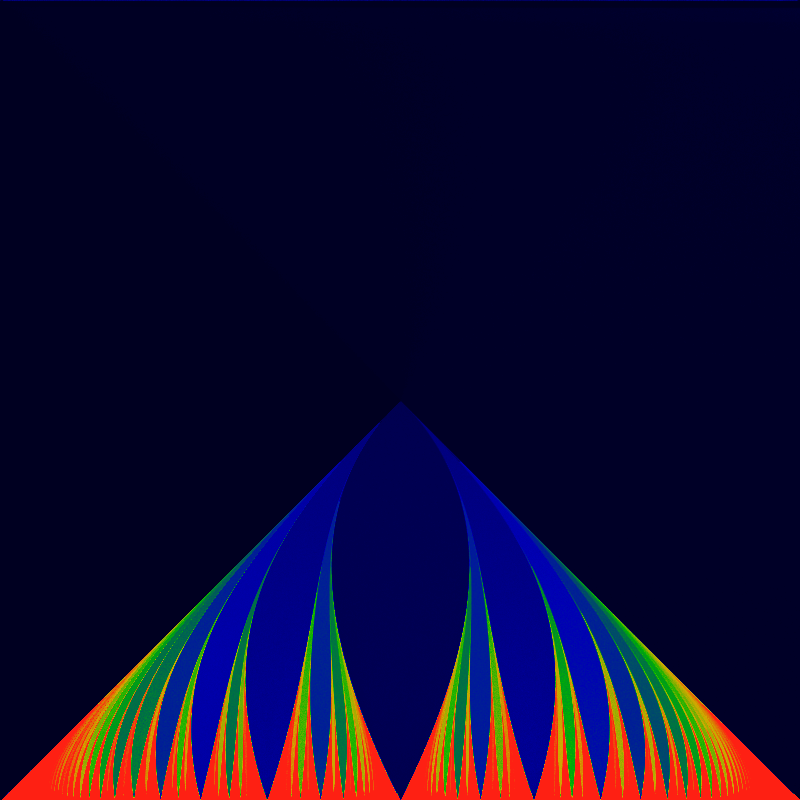
The analogous winding number visualization is
While the recurrence time is shown below
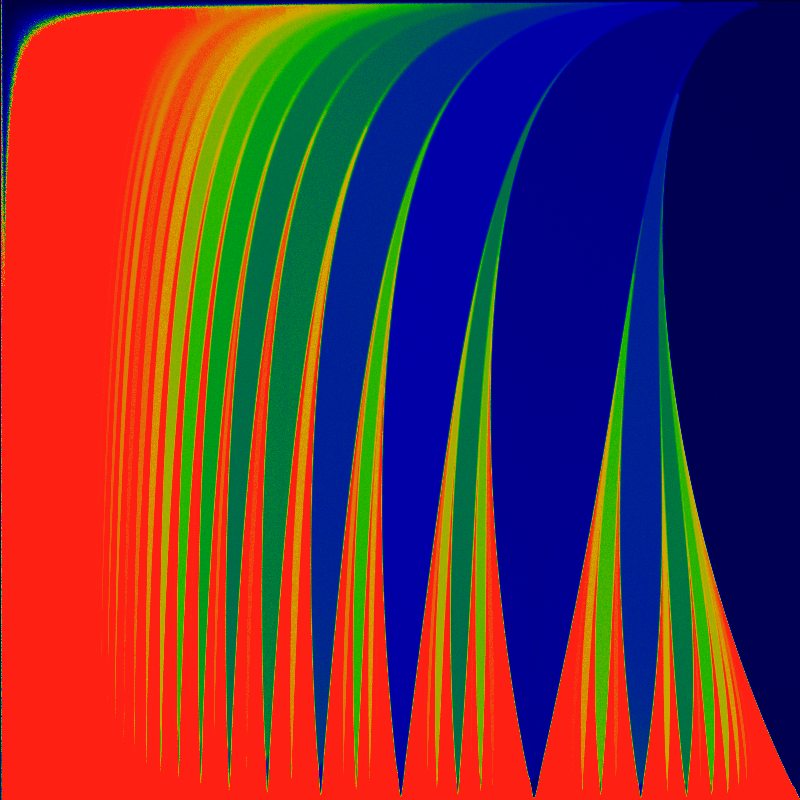
The family resemblance is there, the differences are interesting. Most notable is that the Arnold tongues are now more obviously described by contorted continued fractions, for example by the ones illustrated in the Farey Room pages. The resemblance can be amplified by zooming in. First, zoom to the lower-left quadrant:
Zoom into the lower-right quadrant of the above:
The seeming "artifacts" in the above image are all presumably Moire patterning, which could be erased with some smoothing.
saw(x) = 2x when 0 ≤ x ≤ 0.5
2(x-1) when 0.5 < x ≤ 1.0
and then extending to the whole real-number line by definingsaw(x) = saw(x mod 1)
The analog to the circle map is thenθn+1 = θn + ω - K saw(θn)
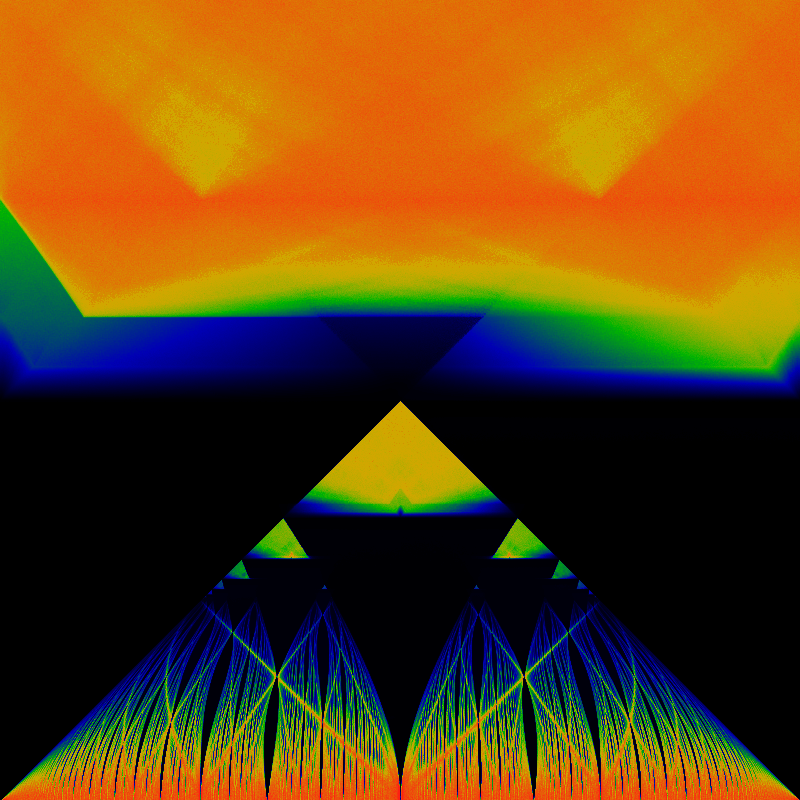
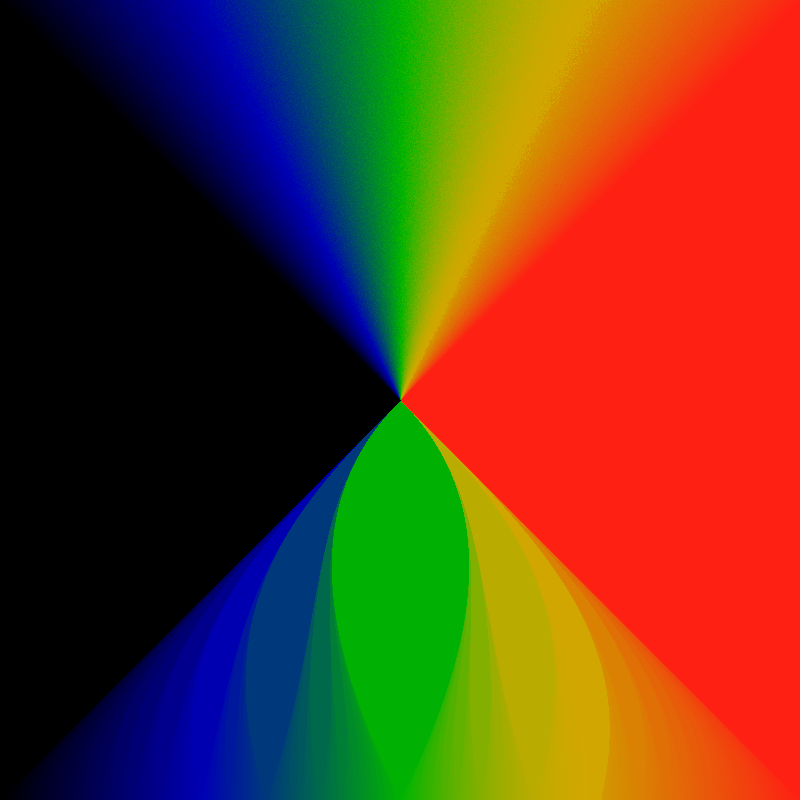
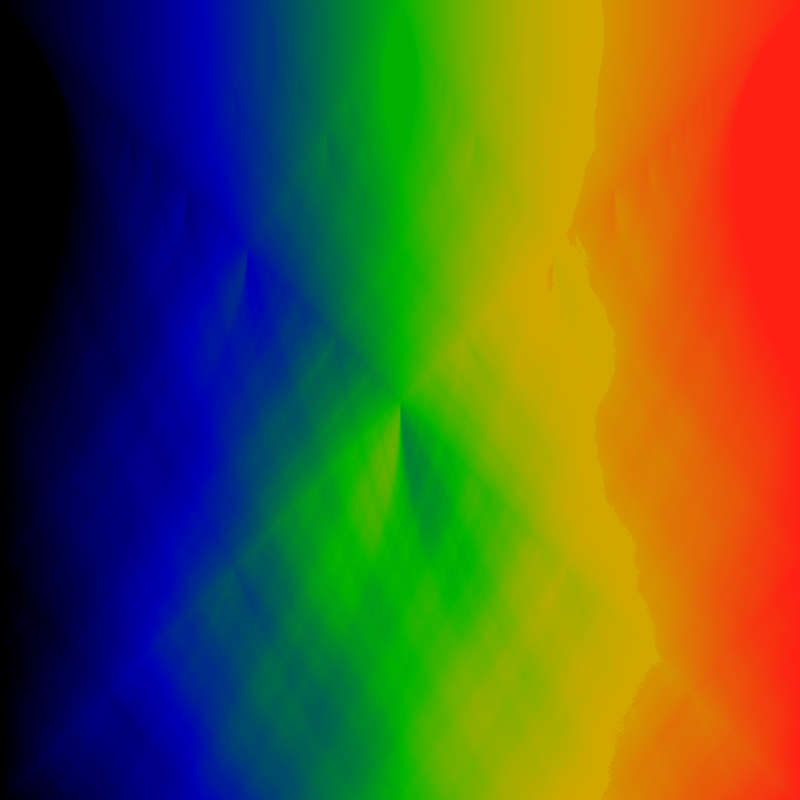
The Bernoulli map is obtained by setting ω = 0 and K = -1.The analogous winding number visualization is
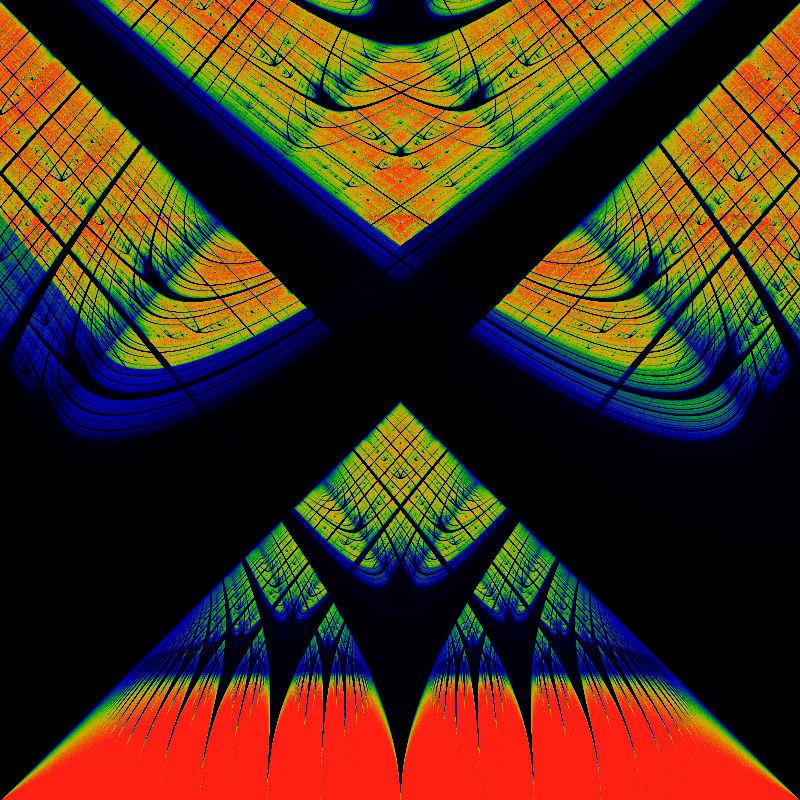
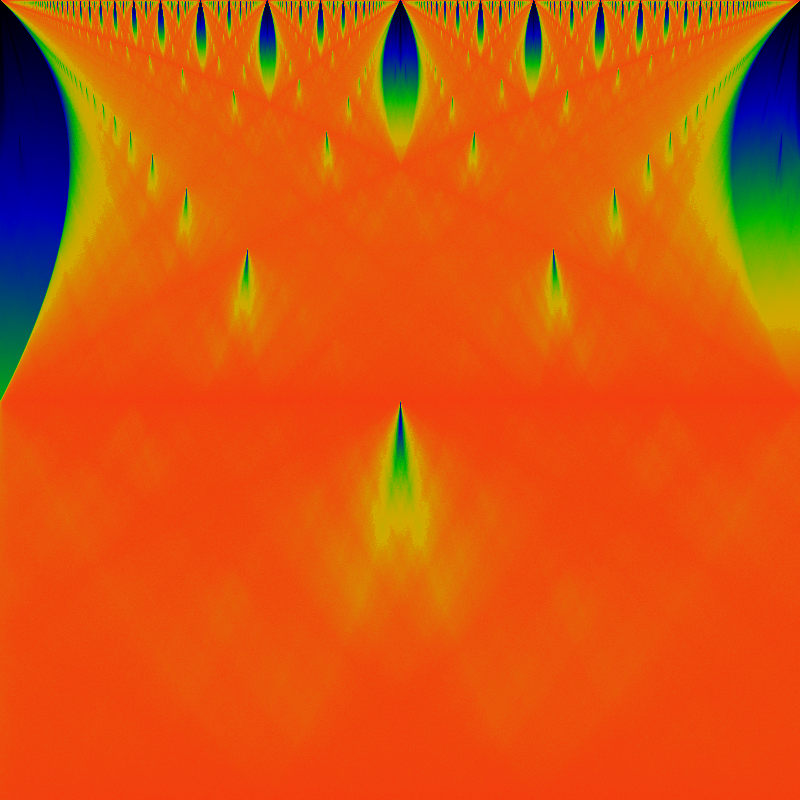
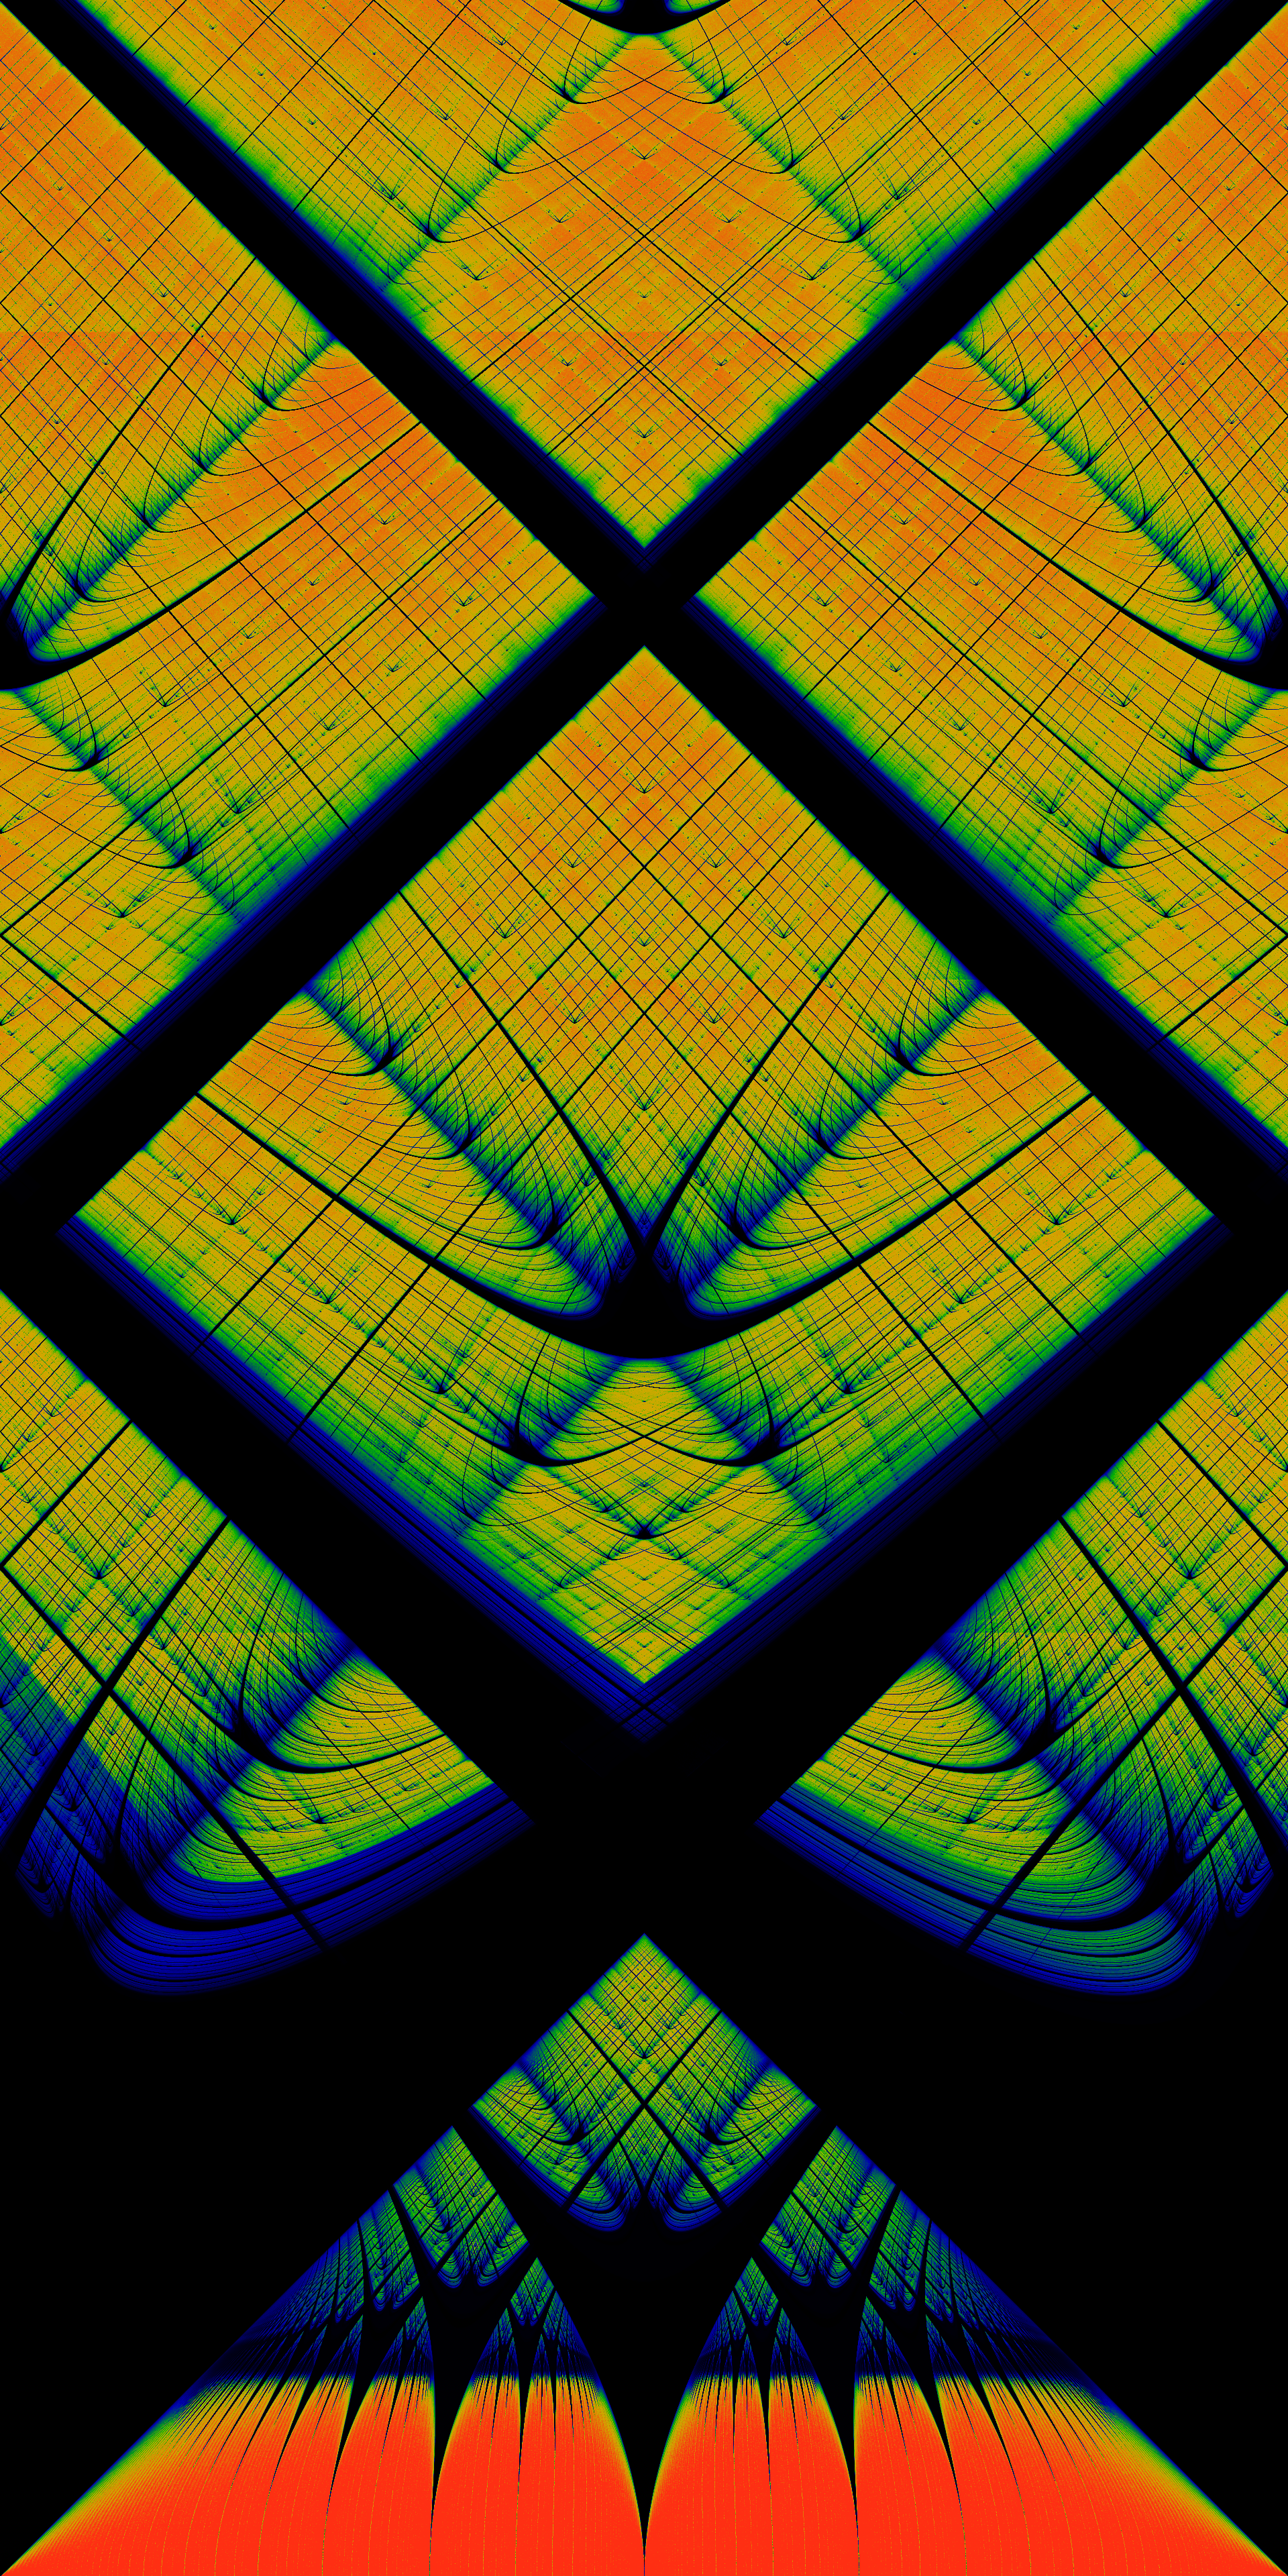
While the recurrence time is shown below. Unlike the earlier color coding schemes, the actual recurrence time can be read off by color: the very deep blue-black at the top hlf is a recurrence time of 1; the deep blue in the center has a time of 2, the next lobes have times of 3,4,5, and so on. Green corresponds to a recurrence time of 10, while red indicates a recurrence time of 20 or more.
Well, these images certainly clarify a lot. The recurrence image is completely missing the superstructure. The superstructure is apparently due entirely to the backwards slope of the sine-wave or triangle wave. The gappy continued-fraction nature of the tongues is more evident than ever.
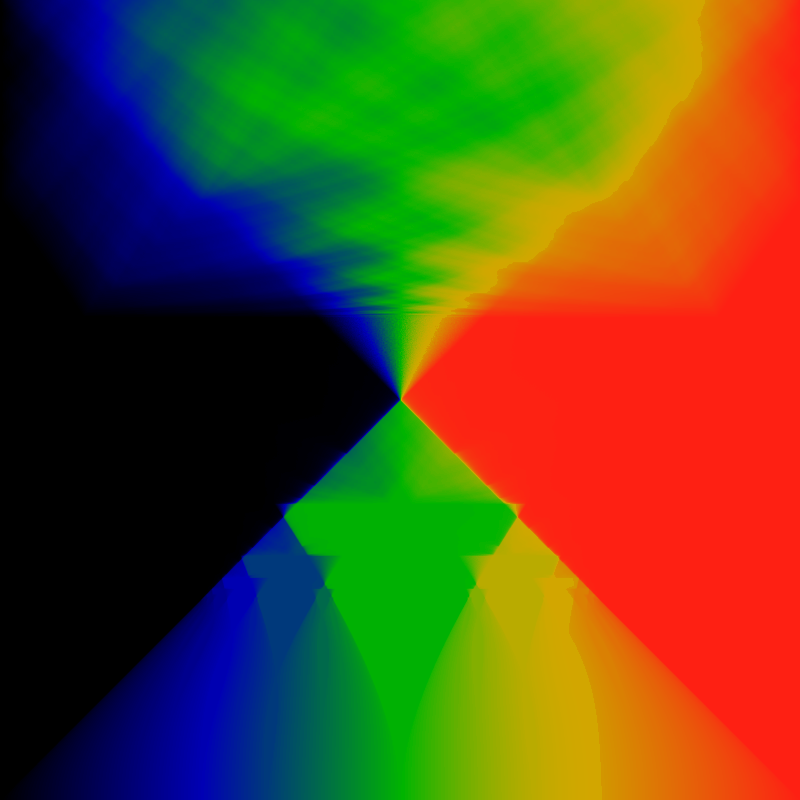
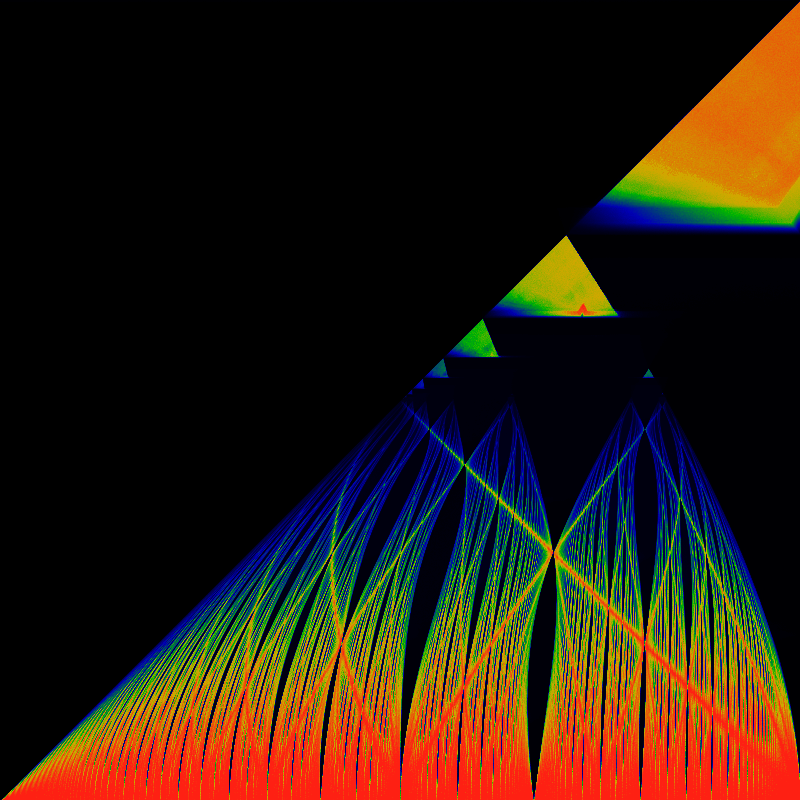
The below is a closeup of the lower-left quadrant, remapped so that the traiangle fils the entire square, i.e lifting the hypotenuse up to the top. Its not clear how the tongues might be further straighened out. The same coloring as above is applied.
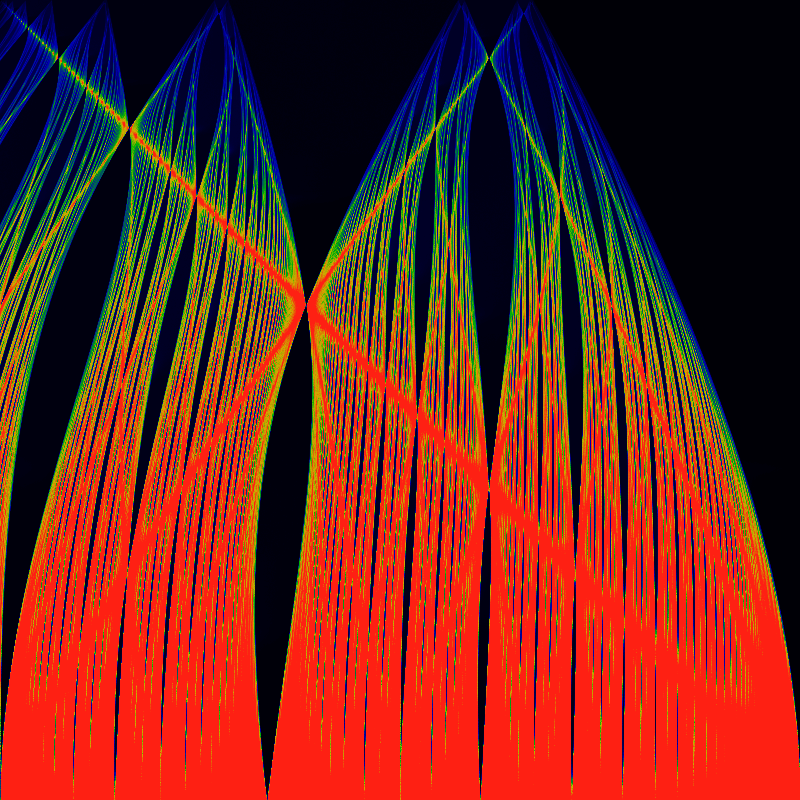
The Bernoulli map is obtained by setting ω = 0 and K = -1.
Again but the recurrence time for the range -1 ≤ K ≤ 0. Again, zero at the top, minus one at the bottom.
Initial version: December 2017

Arnold Tongues in Iterated Maps
by Linas Vepstas is licensed under a Creative Commons
Attribution-ShareAlike 4.0 International License.